## A few hints for debugging SubX programs
Writing programs in SubX is surprisingly pleasant and addictive. Reading
programs is a work in progress, and hopefully the extensive unit tests help.
However, _debugging_ programs is where one really faces up to the low-level
nature of SubX. Even the smallest modifications need testing to make sure they
work. In my experience, there is no modification so small that I get it working
on the first attempt. And when it doesn't work, there are no clear error
messages. Machine code is too simple-minded for that. You can't use a debugger,
since SubX's simplistic ELF binaries contain no debugging information. So
debugging requires returning to basics and practicing with a new, more
rudimentary but hopefully still workable toolkit:
- Start by nailing down a concrete set of steps for reproducibly obtaining the
error or erroneous behavior.
- If possible, turn the steps into a failing test. It's not always possible,
but SubX's primary goal is to keep improving the variety of tests one can
write.
- Start running the single failing test alone. This involves modifying the top
of the program (or the final `.subx` file passed in to `bootstrap translate`) by
replacing the call to `run-tests` with a call to the appropriate `test-`
function.
- Generate a trace for the failing test while running your program in emulated
mode (`bootstrap run`):
```
$ ./translate_subx_debug file1.subx file2.subx ... # generating a.elf
$ ./bootstrap --trace run a.elf arg1 arg2
saving trace to 'last_run'
```
The ability to generate a trace is the essential reason for the existence of
`bootstrap run` mode. It gives far better visibility into program internals than
running natively.
Here's a sample of the contents of `last_run`, with a few boxes highlighted:
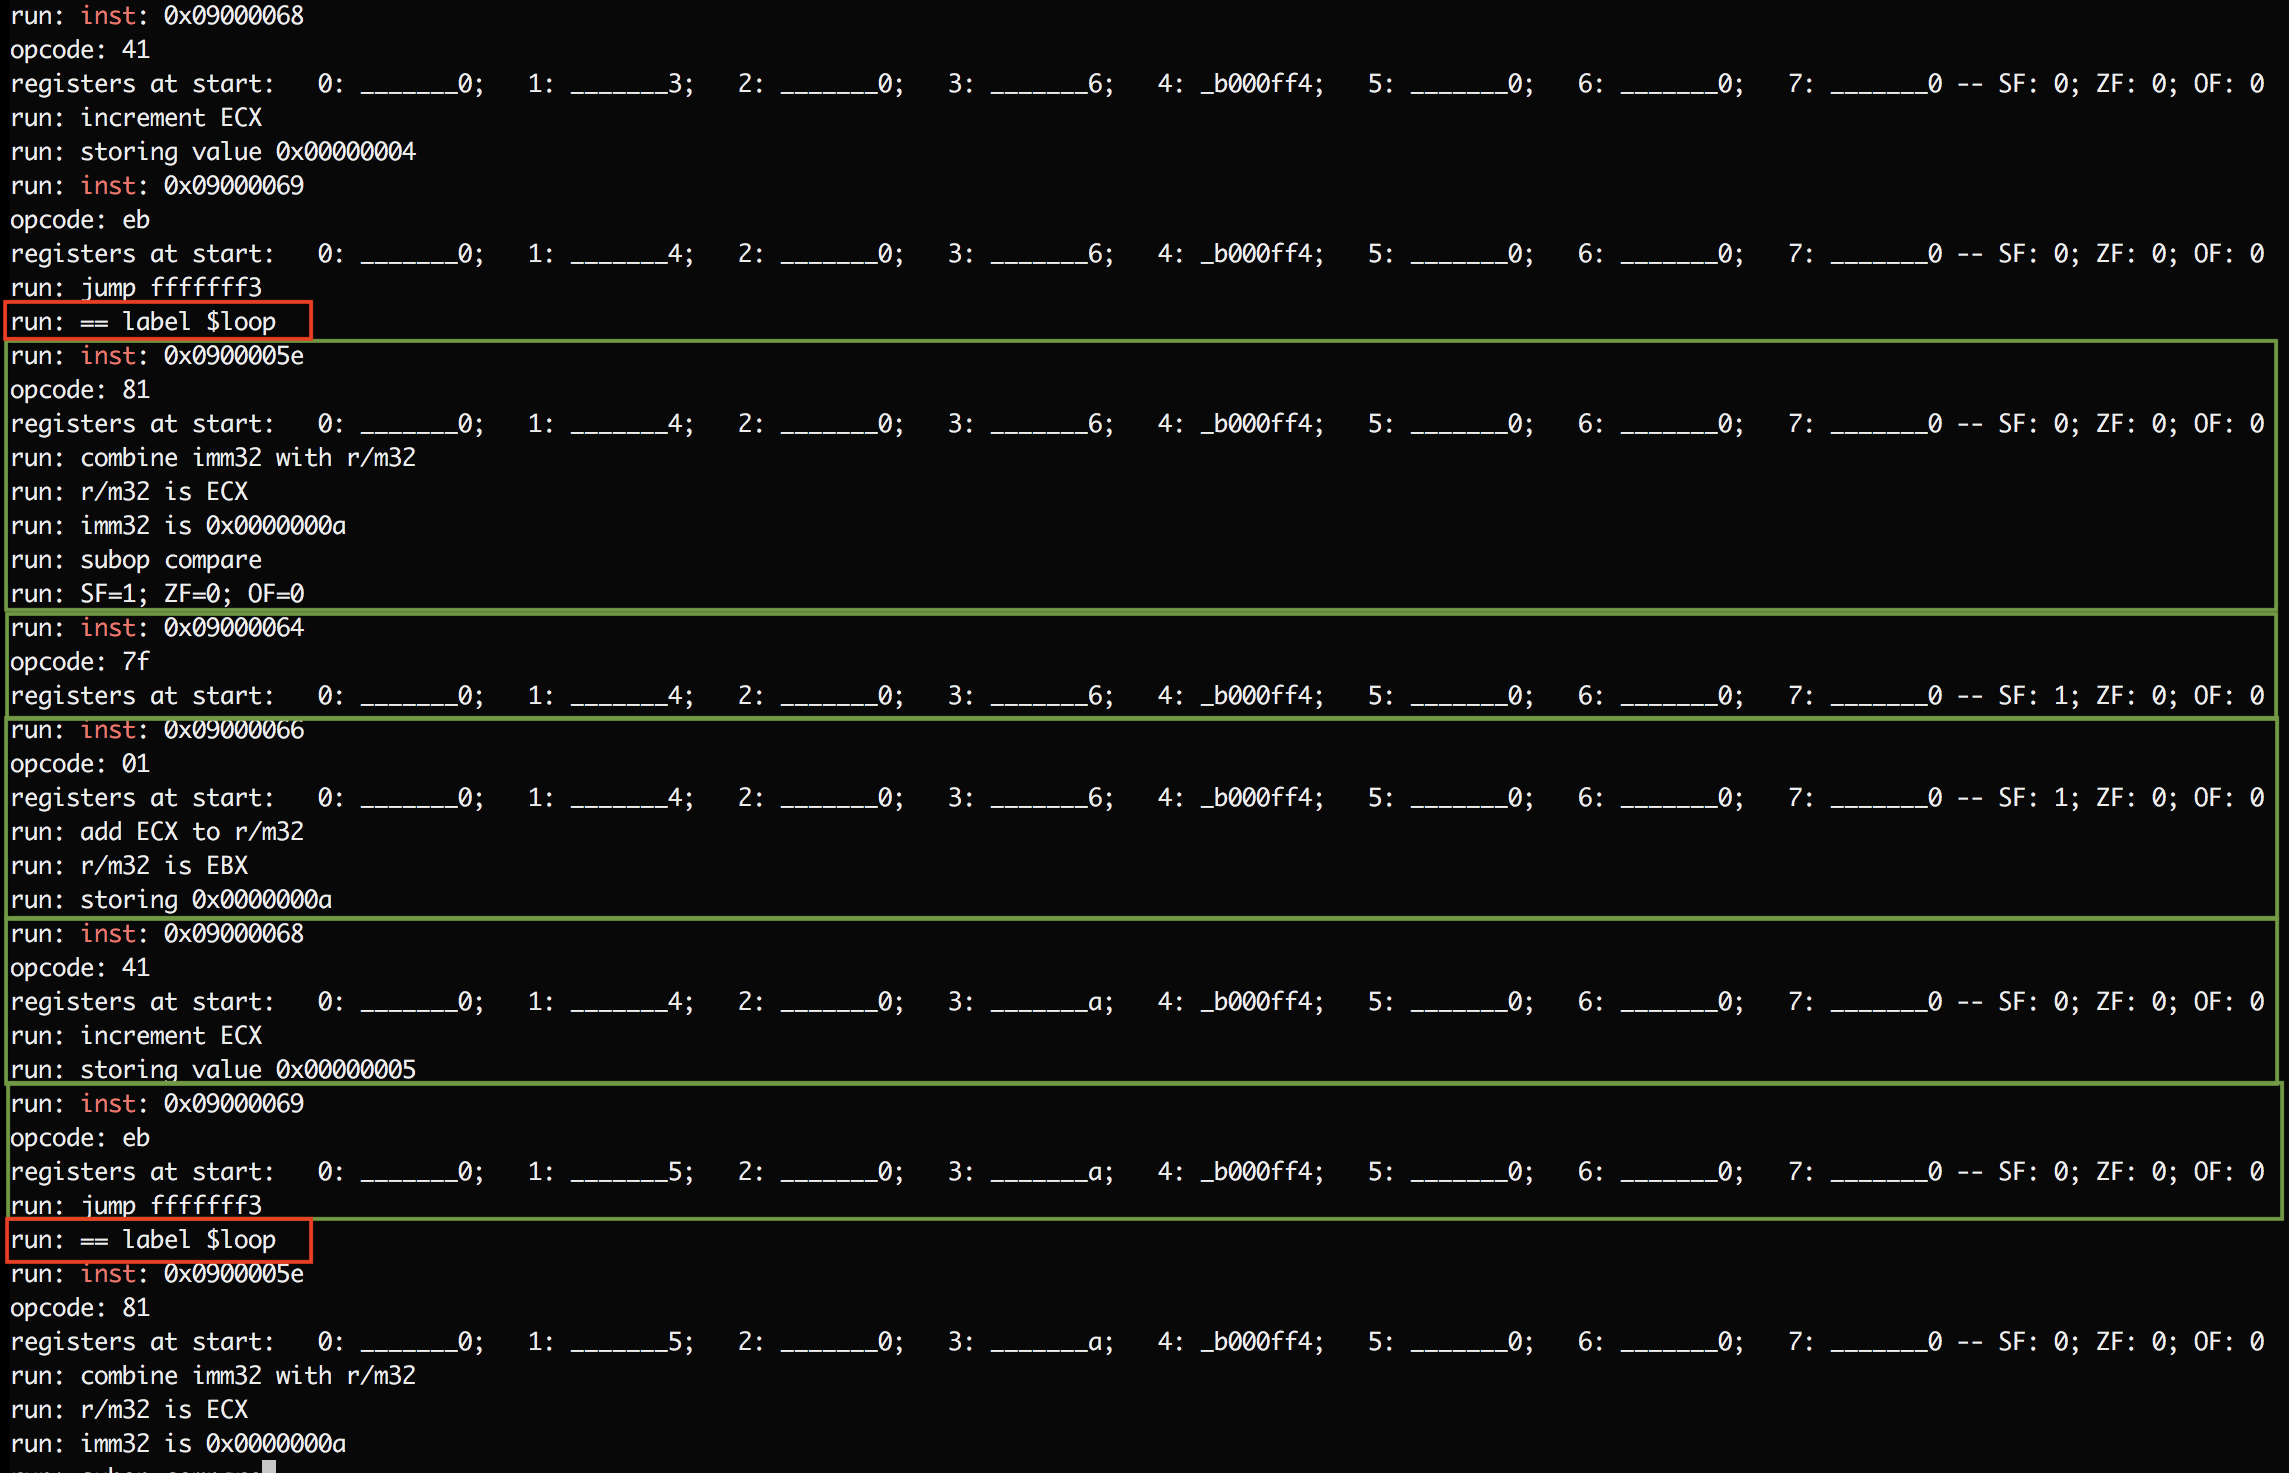 Each of the green boxes shows the trace emitted for a single instruction.
It starts with a line of the form `run: inst: ___` followed by the opcode
for the instruction, the state of registers before the instruction executes,
and various other facts deduced during execution. Some instructions first
print a matching label. In the above screenshot, the red boxes show that
address `0x0900005e` maps to label `$loop` and presumably marks the start of
some loop. Function names get similar `run: == label` lines.
- One quick trick when scanning a trace for the first time:
```
$ grep label last_run
```
This is useful for quickly showing you the control flow for the run, and the
function executing when the error occurred. I find it useful to start with
this information, only looking at the complete trace after I've gotten
oriented on the control flow. Did it get to the loop I just modified? How
many times did it go through the loop?
- Once you have SubX displaying labels in traces, it's a short step to modify
the program to insert more labels just to gain more insight. For example,
consider the following function:
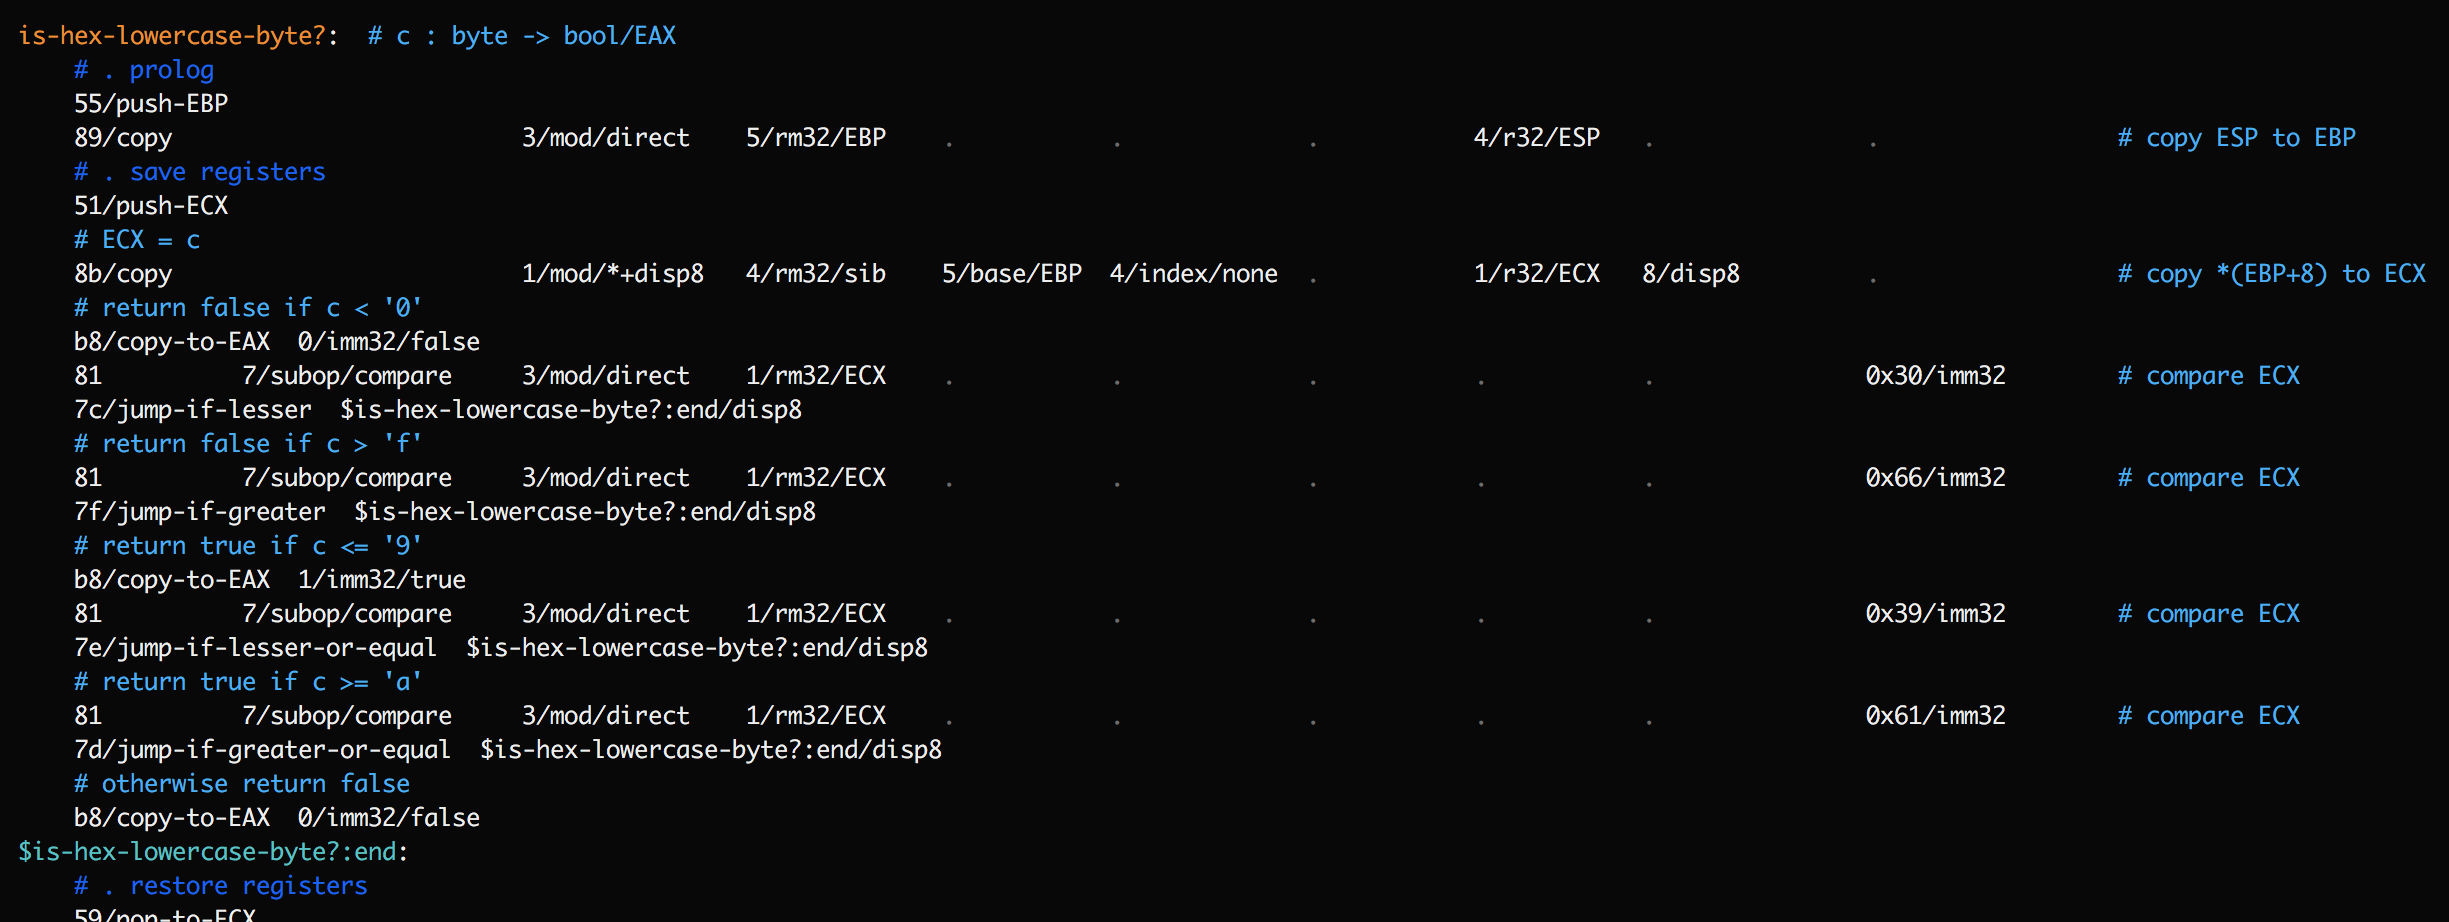 This function contains a series of jump instructions. If a trace shows
`is-hex-lowercase-byte?` being encountered, and then `$is-hex-lowercase-byte?:end`
being encountered, it's still ambiguous what happened. Did we hit an early
exit, or did we execute all the way through? To clarify this, add temporary
labels after each jump:
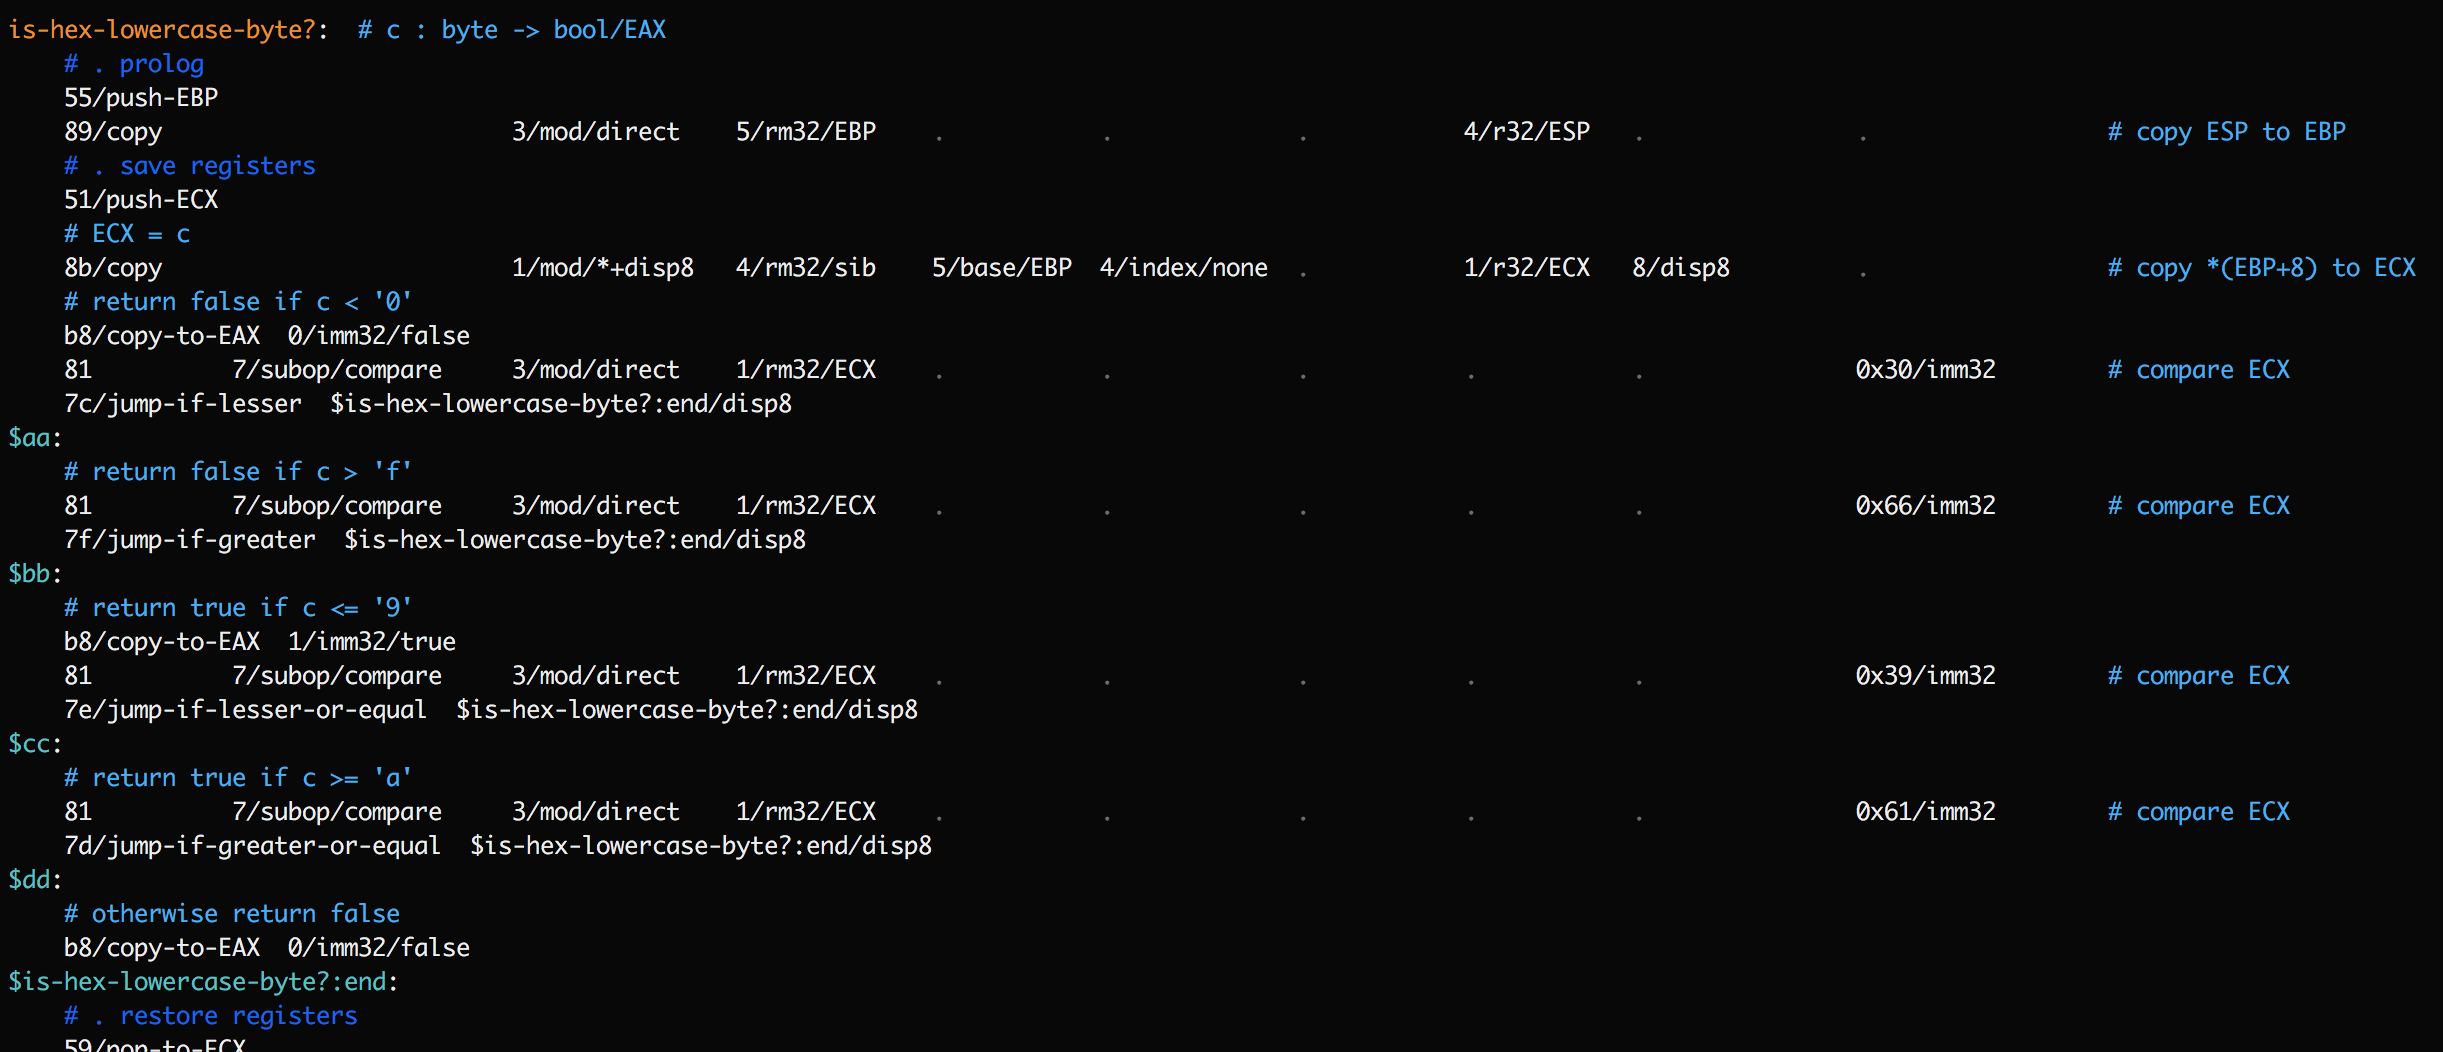 Now the trace should have a lot more detail on which of these labels was
reached, and precisely when the exit was taken.
- If you find yourself wondering, "when did the contents of this memory
address change?", `bootstrap run` has some rudimentary support for _watch
points_. Just insert a label starting with `$watch-` before an instruction
that writes to the address, and its value will start getting dumped to the
trace after every instruction thereafter.
- Once we have a sense for precisely which instructions we want to look at,
it's time to look at the trace as a whole. Key is the state of registers
before each instruction. If a function is receiving bad arguments it becomes
natural to inspect what values were pushed on the stack before calling it,
tracing back further from there, and so on.
I occasionally want to see the precise state of the stack segment, in which
case I uncomment a commented-out call to `dump_stack()` in the `vm.cc`
layer. It makes the trace a lot more verbose and a lot less dense, necessitating
a lot more scrolling around, so I keep it turned off most of the time.
- If the trace seems overwhelming, try [browsing it](https://github.com/akkartik/mu/blob/master/tools/browse_trace.readme.md)
in the 'time-travel debugger'.
- Don't be afraid to slice and dice the trace using Unix tools. For example,
say you have a SubX binary that dies while running tests. You can see what
test it's segfaulting at by compiling it with debug information using
`./translate_subx_debug`, and then running:
```
grep 'label test-' |tail
```
Just read out the last test printed out before the segfault.
Even outside of tests, I can often quickly debug an error just by scanning
the end of a trace for labels:
```
$ grep label last_run |tail
```
Knowing _where_ the error occurred is often enough to put me on the right
track to debugging an error.
Hopefully these hints are enough to get you started. The main thing to
remember is to not be afraid of modifying the sources. A good debugging
session gets into a nice rhythm of generating a trace, staring at it for a
while, modifying the sources, regenerating the trace, and so on. Email
[me](mailto:mu@akkartik.com) if you'd like another pair of eyes to stare at a
trace, or if you have questions or complaints.
 Each of the green boxes shows the trace emitted for a single instruction.
It starts with a line of the form `run: inst: ___` followed by the opcode
for the instruction, the state of registers before the instruction executes,
and various other facts deduced during execution. Some instructions first
print a matching label. In the above screenshot, the red boxes show that
address `0x0900005e` maps to label `$loop` and presumably marks the start of
some loop. Function names get similar `run: == label` lines.
- One quick trick when scanning a trace for the first time:
```
$ grep label last_run
```
This is useful for quickly showing you the control flow for the run, and the
function executing when the error occurred. I find it useful to start with
this information, only looking at the complete trace after I've gotten
oriented on the control flow. Did it get to the loop I just modified? How
many times did it go through the loop?
- Once you have SubX displaying labels in traces, it's a short step to modify
the program to insert more labels just to gain more insight. For example,
consider the following function:
 This function contains a series of jump instructions. If a trace shows
`is-hex-lowercase-byte?` being encountered, and then `$is-hex-lowercase-byte?:end`
being encountered, it's still ambiguous what happened. Did we hit an early
exit, or did we execute all the way through? To clarify this, add temporary
labels after each jump:
 Now the trace should have a lot more detail on which of these labels was
reached, and precisely when the exit was taken.
- If you find yourself wondering, "when did the contents of this memory
address change?", `bootstrap run` has some rudimentary support for _watch
points_. Just insert a label starting with `$watch-` before an instruction
that writes to the address, and its value will start getting dumped to the
trace after every instruction thereafter.
- Once we have a sense for precisely which instructions we want to look at,
it's time to look at the trace as a whole. Key is the state of registers
before each instruction. If a function is receiving bad arguments it becomes
natural to inspect what values were pushed on the stack before calling it,
tracing back further from there, and so on.
I occasionally want to see the precise state of the stack segment, in which
case I uncomment a commented-out call to `dump_stack()` in the `vm.cc`
layer. It makes the trace a lot more verbose and a lot less dense, necessitating
a lot more scrolling around, so I keep it turned off most of the time.
- If the trace seems overwhelming, try [browsing it](https://github.com/akkartik/mu/blob/master/tools/browse_trace.readme.md)
in the 'time-travel debugger'.
- Don't be afraid to slice and dice the trace using Unix tools. For example,
say you have a SubX binary that dies while running tests. You can see what
test it's segfaulting at by compiling it with debug information using
`./translate_subx_debug`, and then running:
```
grep 'label test-' |tail
```
Just read out the last test printed out before the segfault.
Even outside of tests, I can often quickly debug an error just by scanning
the end of a trace for labels:
```
$ grep label last_run |tail
```
Knowing _where_ the error occurred is often enough to put me on the right
track to debugging an error.
Hopefully these hints are enough to get you started. The main thing to
remember is to not be afraid of modifying the sources. A good debugging
session gets into a nice rhythm of generating a trace, staring at it for a
while, modifying the sources, regenerating the trace, and so on. Email
[me](mailto:mu@akkartik.com) if you'd like another pair of eyes to stare at a
trace, or if you have questions or complaints.